A newer version of this visualization is available.
A Powerful Sequence of Flares Start September 2017
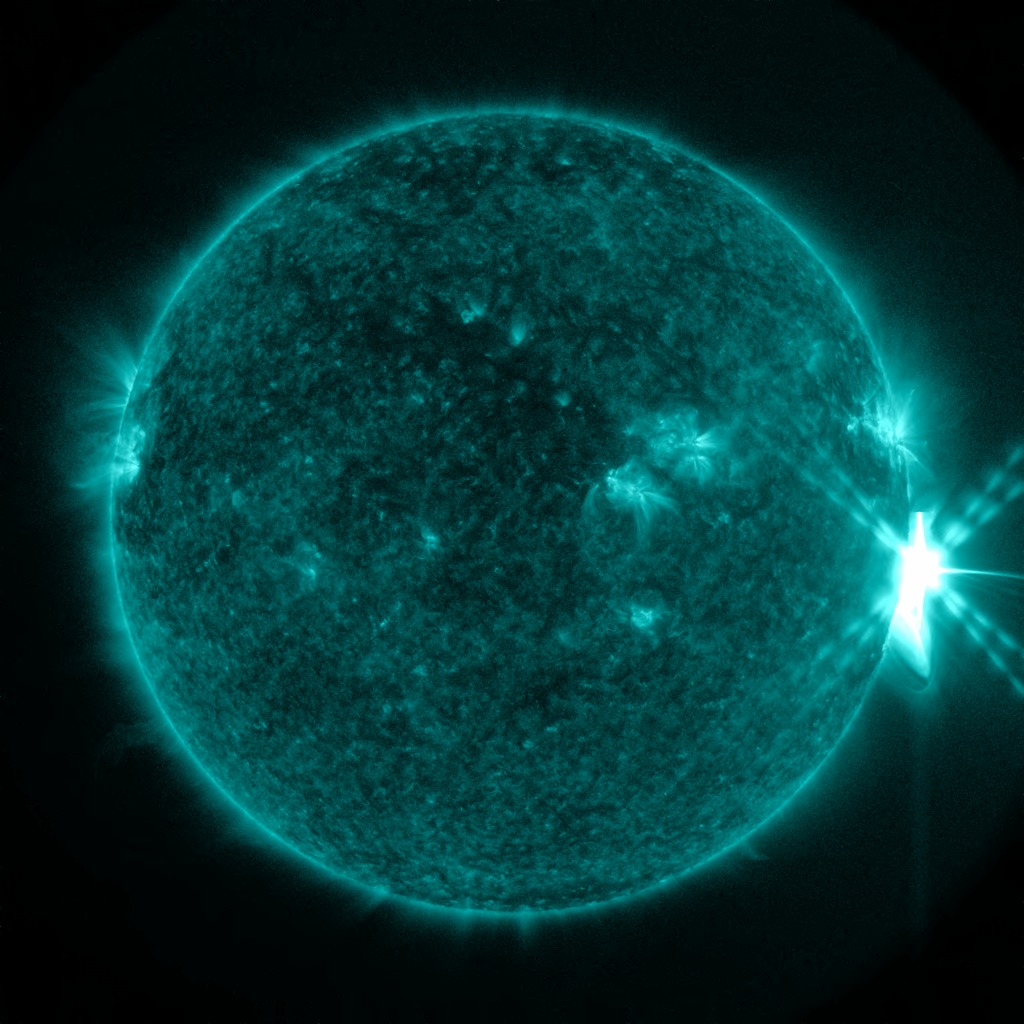
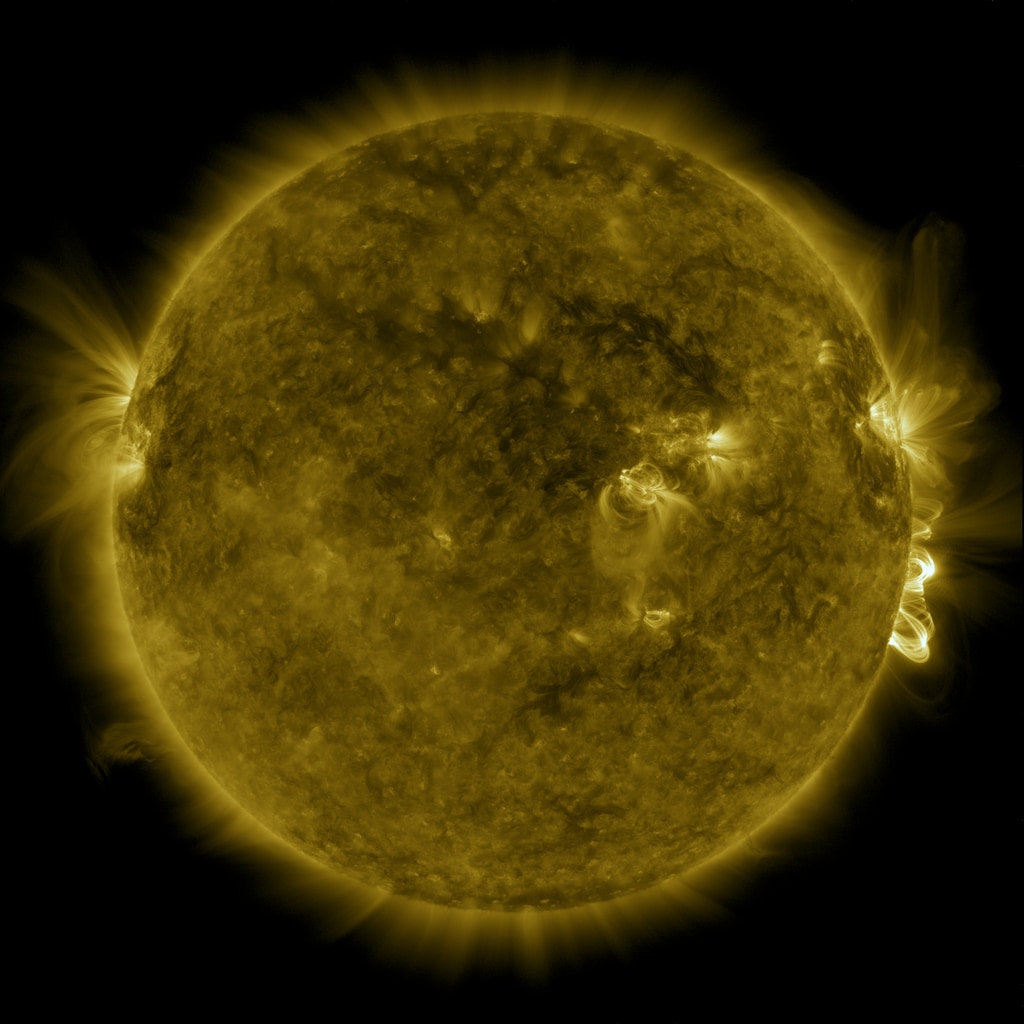
Short video showing the sequence of M and X flares starting on September 4, 2017 and culminating with an X9.3 flare — the largest of the solar cycle.
Music: "Networked" from Killer Tracks
Watch this video on the NASA Goddard YouTube channel.
Complete transcript available.
One minute video showing the two X flares on September 6, 2017. The second was an X9.3 flare — the largest of the solar cycle.
Music: "Networked" from Killer Tracks
Complete transcript available.
Active region 2673 emitted a series of flares in early September, 2017, including:
--an M5.5 at 4:33 p.m. EDT on Sept. 4, 2017
--an X2.2 at 5:10 a.m. EDT on Sept. 6, 2017
--an X9.3 at 8:02 a.m. EDT on Sept. 6, 2017
--an M7.3 at 6:15 a.m. EDT on Sept. 7, 2017
--an X1.3 at 10:36 a.m. EDT on Sept. 7, 2017
--an M8.1 at 3:49 a.m. EDT on Sept. 8, 2017
--an X8.2 at 12:47 p.m. EDT on Sept. 10, 2017
NASA’s Solar Dynamics Observatory, which watches the sun constantly, captured images of the events. Solar flares are powerful bursts of radiation. Harmful radiation from a flare cannot pass through Earth's atmosphere to physically affect humans on the ground, however — when intense enough — they can disturb the atmosphere in the layer where GPS and communications signals travel.
To see how this event may affect Earth, please visit NOAA's Space Weather Prediction Center at http://spaceweather.gov, the U.S. government's official source for space weather forecasts, alerts, watches and warnings.
X-class denotes the most intense flares, while the number provides more information about its strength. An X2 is twice as intense as an X1, an X3 is three times as intense, etc.
The X9.3 flare was the largest flare so far in the current solar cycle, the approximately 11-year-cycle during which the sun’s activity waxes and wanes. The current solar cycle began in December 2008, and is now decreasing in intensity and heading toward solar minimum. This is a phase when such eruptions on the sun are increasingly rare, but history has shown that they can nonetheless be intense.
September 10, X8.2
Short video showing the Sept. 10, 2017 X8.2 flare captured by NASA's Solar Dynamics Observatory and shows a blend of light from the 171 and 304 angstrom wavelengths.
Credit: NASA/GSFC/SDO

An X8.2 class solar flare flashes in the edge of the Sun on Sept. 10, 2017. This image was captured by NASA's Solar Dynamics Observatory and shows a blend of light from the 171 and 304 angstrom wavelengths.
Credit: NASA/GSFC/SDO

An X8.2 class solar flare flashes in the edge of the Sun on Sept. 10, 2017. This image was captured by NASA's Solar Dynamics Observatory and shows a blend of light from the 171 and 304 angstrom wavelengths.
Credit: NASA/GSFC/SDO

An X8.2 class solar flare flashes in the edge of the Sun on Sept. 10, 2017. This image was captured by NASA's Solar Dynamics Observatory and shows a blend of light from the 171 and 304 angstrom wavelengths.
Credit: NASA/GSFC/SDO

An X8.2 class solar flare flashes in the edge of the Sun on Sept. 10, 2017. This image was captured by NASA's Solar Dynamics Observatory and shows a blend of light from the 171 and 131 angstrom wavelengths.
Credit: NASA/GSFC/SDO

An X8.2 class solar flare flashes in the edge of the Sun on Sept. 10, 2017. This image was captured by NASA's Solar Dynamics Observatory and shows a blend of light from the 171 and 335 angstrom wavelengths.
Credit: NASA/GSFC/SDO

An X8.2 class solar flare flashes in the edge of the Sun on Sept. 10, 2017. This image was captured by NASA's Solar Dynamics Observatory and shows a blend of light from the 171 and 335 angstrom wavelengths.
Credit: NASA/GSFC/SDO

Animated gif. NASA’s Solar Dynamics Observatory captured these images of an X8.2 solar flare – as seen in the bright area on the right – on Sept. 10, 2017. The images are a blend of extreme ultraviolet light in the 171 and 335 angstrom wavelengths.
Credit: NASA/GSFC/SDO

Image of the Sept. 10 X8.2 solar flare captured by the Solar Dynamics Observatory in extreme ultraviolet light (131 angstrom wavelength)
Credit: NASA/GSFC/SDO

NASA’s Solar Dynamics Observatory captured this image of an M8.1 solar flare – as seen in the bright area on the right – on Sept. 8, 2017. The image is a blend of extreme ultraviolet light in the 131 and 171 angstrom wavelengths.
Credit: NASA/GSFC/SDO

NASA’s Solar Dynamics Observatory captured this image of an M8.1 solar flare – as seen in the bright area on the right – on Sept. 8, 2017. The image is a blend of extreme ultraviolet light in the 131 and 171 angstrom wavelengths. Full 4k.
Credit: NASA/GSFC/SDO

Animated gif. NASA’s Solar Dynamics Observatory captured these images of an M8.1 solar flare – as seen in the bright area on the right – on Sept. 8, 2017. The images are extreme ultraviolet light in the 131 angstrom wavelength.
Credit: NASA/GSFC/SDO

Image of the Sept. 7 X1.3 solar flare captured by the Solar Dynamics Observatory in extreme ultraviolet light (131 angstrom wavelength)
Credit: NASA/GSFC/SDO

Footage of the Sept. 7 X1.3 solar flare captured by the Solar Dynamics Observatory in extreme ultraviolet light (131 angstrom wavelength)
Credit: NASA/GSFC/SDO

An X9.3 class solar flare flashes in the middle of the Sun on Sept. 6, 2017. This image was captured by NASA's Solar Dynamics Observatory and shows a blend of light from the 171 and 131 angstrom wavelengths.
Credit: NASA/GSFC/SDO

An X9.3 class solar flare flashes in the middle of the Sun on Sept. 6, 2017. This image was captured by NASA's Solar Dynamics Observatory and shows a blend of light from the 171 and 131 angstrom wavelengths.
Credit: NASA/GSFC/SDO

This image shows light in both visible and 304 angstrom extreme ultraviolet wavelengths, showing both sunspots visible on the Sun's surface and the flare in the solar atmosphere.
Credit: NASA/GSFC/SDO

Different views of the X9.3 flare from Sept. 6, 2017. On the left, it flashes in a blend of 131 and 171 angstrom light. On the right it shows light in both visible and 304 angstrom extreme ultraviolet wavelengths, revealing both sunspots visible on the Sun's surface and the flare in the solar atmosphere.>Credit: NASA/GSFC/SDO

This gif shows the X9.3 flares that the Sun emitted on Sept. 6, 2017. The imagery was captured by NASA's Solar Dynamics Observatory and shows light in the 171 angstrom wavelength.
Credit: NASA/GSFC/SDO

This gif shows the X9.3 flares that the Sun emitted on Sept. 6, 2017. The imagery was captured by NASA's Solar Dynamics Observatory and shows light in the 171 angstrom wavelength.
Credit: NASA/GSFC/SDO

This gif shows both the X2.2 and the X9.3 flares that the Sun emitted on Sept. 6, 2017. The imagery was captured by NASA's Solar Dynamics Observatory and shows light in the 131 angstrom wavelength.
Credit: NASA/GSFC/SDO

An X9.3 class solar flare flashes in the middle of the Sun on Sept. 6, 2017. This image was captured by NASA's Solar Dynamics Observatory and shows a blend of light from the 171 and 131 angstrom wavelengths. A separate image of the Earth provides scale.
Credit: NASA/GSFC/SDO

Footage of the Sept. 6 X2.2 and X9.3 solar flares captured by the Solar Dynamics Observatory in extreme ultraviolet light (171 angstrom wavelength) with Earth for scale

An X9.3 class solar flare flashes in the middle of the Sun on Sept. 6, 2017. This image was captured by NASA's Solar Dynamics Observatory and shows a blend of light from the 171 and 131 angstrom wavelengths. A separate image of the Earth provides scale.
Credit: NASA/GSFC/SDO

An X9.3 class solar flare flashes in the middle of the sun on Sept. 6, 2017. This image was captured by NASA's Solar Dynamics Observatory at 12:11:34UT and shows light in the 171 angstrom wavelength.
Credit: NASA/GSFC/SDO

An X9.3 class solar flare flashes in the middle of the sun on Sept. 6, 2017. This image was captured by NASA's Solar Dynamics Observatory at 11:58:42UT and shows light in the 304 angstrom wavelength.
Credit: NASA/GSFC/SDO

An X9.3 class solar flare flashes in the middle of the sun on Sept. 6, 2017. This image was captured by NASA's Solar Dynamics Observatory at 11:58:20UT and shows light in the 131 angstrom wavelength.
Credit: NASA/GSFC/SDO

An M5.5 class solar flare flashes in the middle of the Sun on Sept. 4, 2017. This image was captured by NASA's Solar Dynamics Observatory and shows light in the 131 angstrom wavelength.
Credit: NASA/GSFC/SDO

Animated gif of the sequence of flares peaking in the M5.5 class solar flare on Sept. 4, 2017.
Credit: NASA/GSFC/SDO

Animated gif of the sequence of flares peaking in the M5.5 class solar flare on Sept. 4, 2017. Close-up on the flaring region.
Credit: NASA/GSFC/SDO
For More Information
Credits
Please give credit for this item to:
NASA's Goddard Space Flight Center. However individual items should be credited as indicated above.
-
Producer
- Scott Wiessinger (USRA)
-
Technical support
- Aaron E. Lepsch (ADNET Systems, Inc.)
-
Science writer
- Karen Fox (ADNET Systems, Inc.)
-
Visualizer
- Tom Bridgman (Global Science and Technology, Inc.)
Release date
This page was originally published on Wednesday, September 6, 2017.
This page was last updated on Wednesday, May 3, 2023 at 1:47 PM EDT.

