Global Terrestrial Water Storage Anomaly (March 2015 - March 2016)
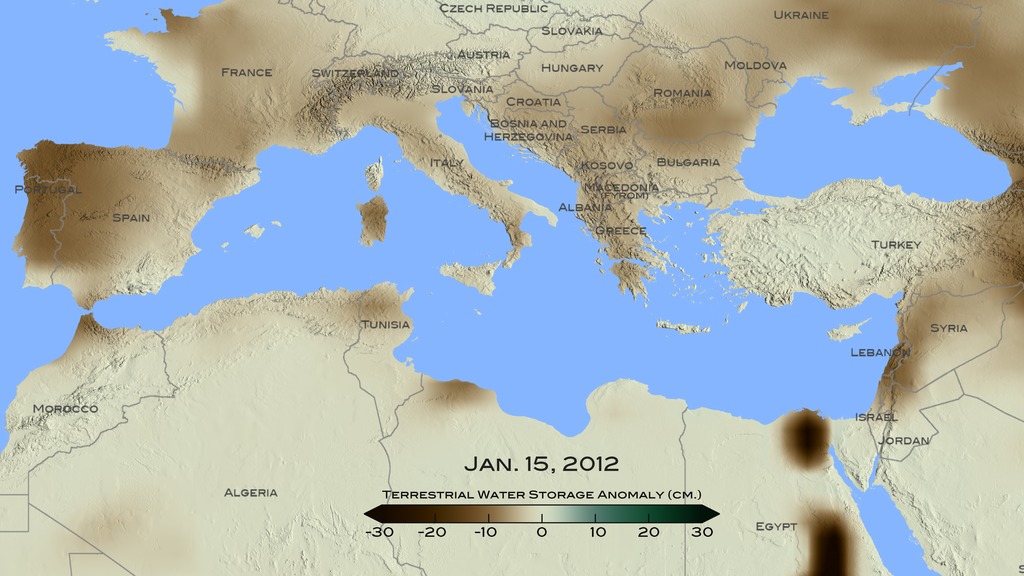
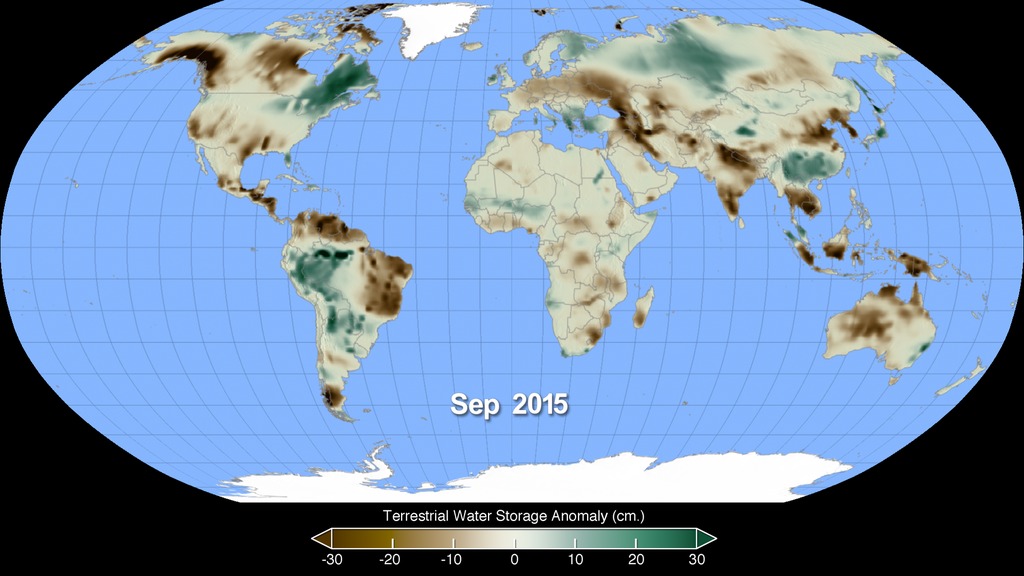
Animation showing Terrestrial Water Storage Anomaly (TWSA) data from March 2015 to March 2016. Shades of orange indicate areas with less ground water than normal and shades of blue are areas with more ground water than normal, which correlates to droughts and floods in these various regions.
A pair of experimental twin satellites called the Gravity Recovery And Climate Experiment, or "GRACE", were launched in March 2002. Since then they have been collecting gravity measurements which scientists use to derive Terrestrial Water Storage Anomalies (TWSA). TWSA can then be used as an indicator for drought and flood conditions across the globe. For more information on the GRACE mission please visit http://www.nasa.gov/mission_pages/Grace/
This animation is depicts the same data as above, but is in a flat map (or Platte Carre) projection without a date overlay or color bar burned in. (NOTE: This sample animation repeats twice.)

Water storage anomaly color bar. Deepening shades of orange indicate areas below average and shades of darker shades of blue are above average ground water storage.
Credits
Please give credit for this item to:
NASA's Scientific Visualization Studio
-
Visualizer
- Alex Kekesi (Global Science and Technology, Inc.)
-
Scientists
- Doug C. Morton (NASA/GSFC)
- Yang Chen (University of California, Irvine)
-
Producers
- Michelle Handleman (USRA)
- Claire Saravia (NASA/GSFC)
- Matthew R. Radcliff (USRA)
Release date
This page was originally published on Thursday, July 28, 2016.
This page was last updated on Sunday, January 5, 2025 at 11:03 PM EST.
Missions
This page is related to the following missions:Datasets used
-
TWS Anomaly (Terrestrial Water Storage Anomaly) [Gravity Recovery and Climate Experiment (GRACE)]
ID: 889
Note: While we identify the data sets used on this page, we do not store any further details, nor the data sets themselves on our site.


