A newer version of this visualization is available.
Five-Year Global Temperature Anomalies from 1880 to 2016
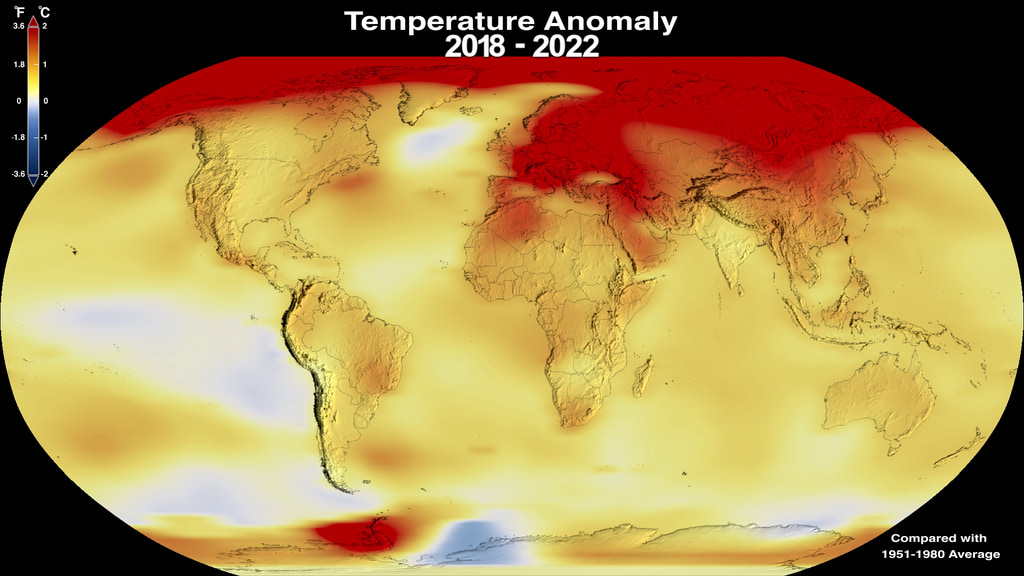
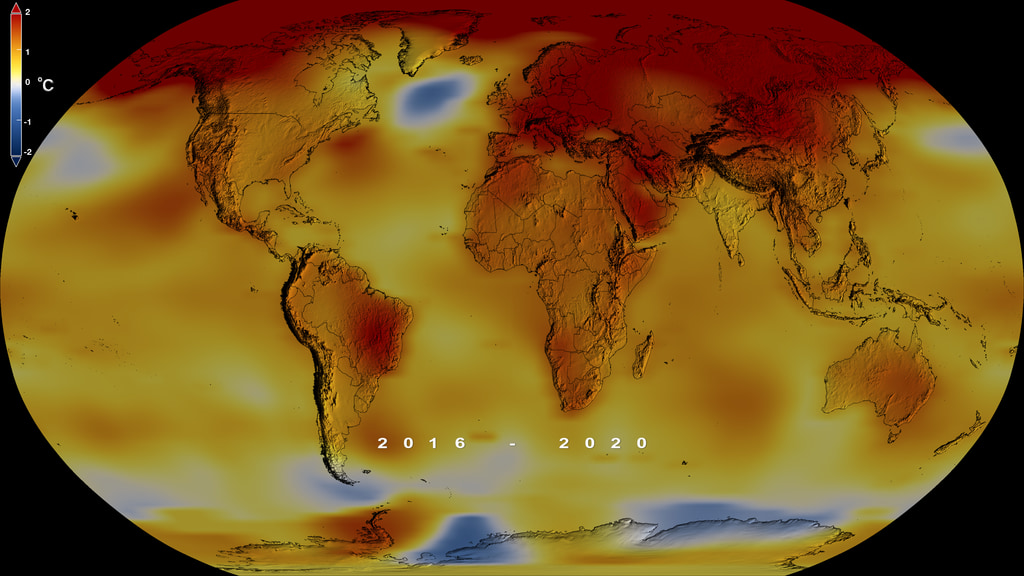
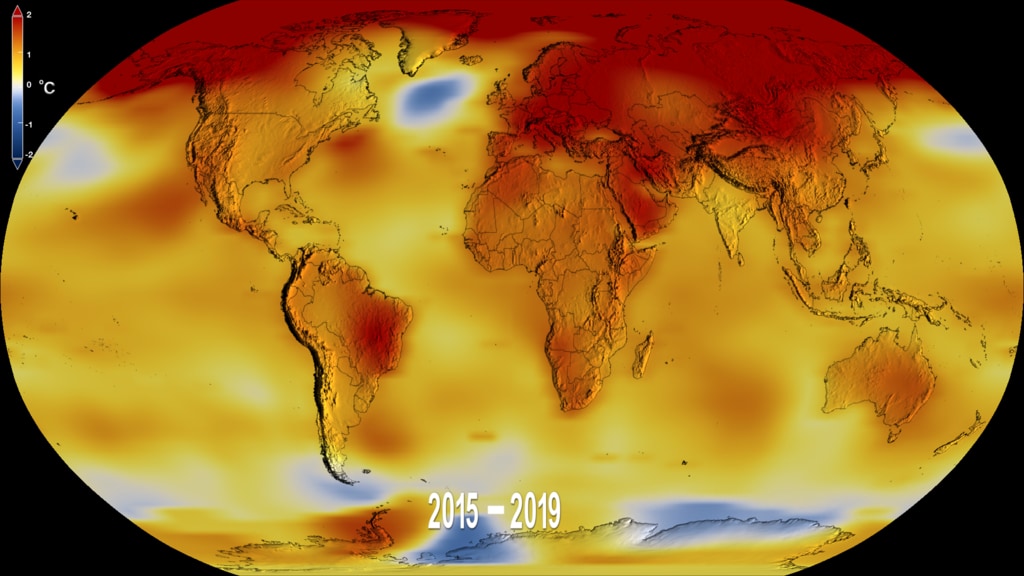
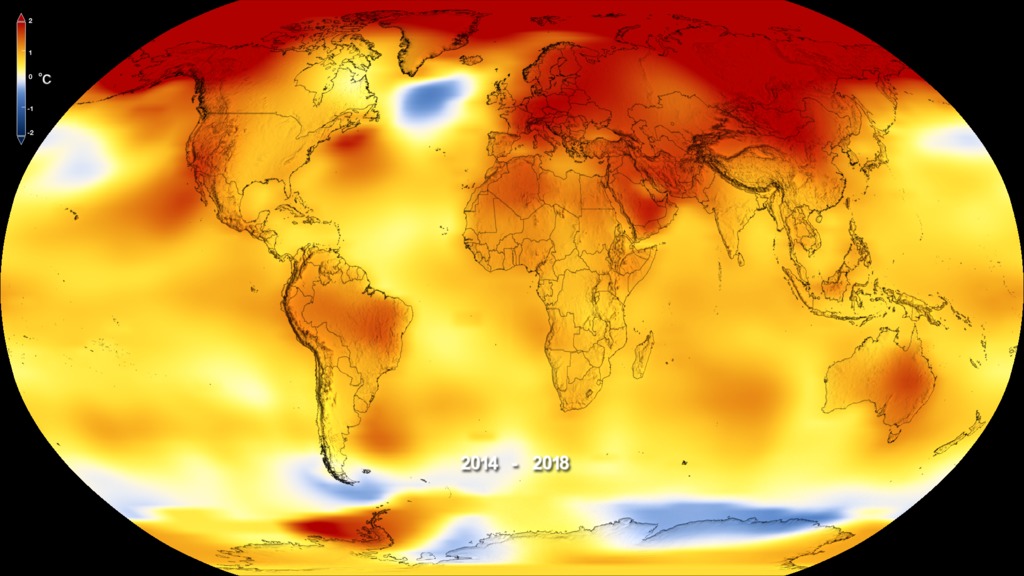
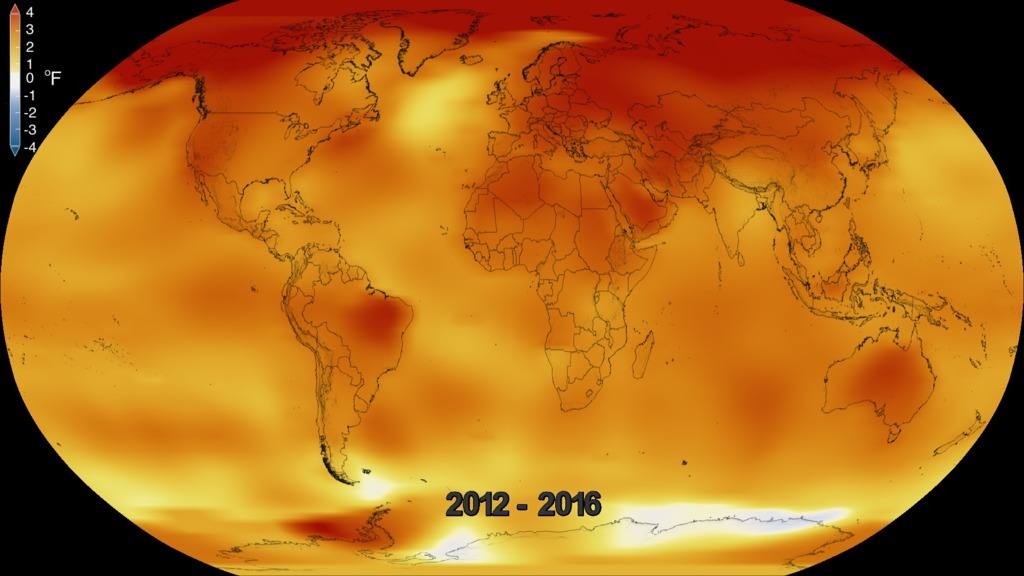
This color-coded map displays a progression of changing global surface temperatures anomalies from 1880 through 2016. The final frame represents global temperature anomalies averaged from 2012 through 2016 in degrees Celsius.
Earth’s 2016 surface temperatures were the warmest since modern recordkeeping began in 1880, according to independent analyses by NASA and the National Oceanic and Atmospheric Administration (NOAA).
Globally-averaged temperatures in 2016 were 1.78 degrees Fahrenheit (0.99 degrees Celsius) warmer than the mid-20th century mean. This makes 2016 the third year in a row to set a new record for global average surface temperatures.
The 2016 temperatures continue a long-term warming trend, according to analyses by scientists at NASA’s Goddard Institute for Space Studies (GISS) in New York. NOAA scientists concur with the finding that 2016 was the warmest year on record based on separate, independent analyses of the data.
Because weather station locations and measurement practices change over time, there are uncertainties in the interpretation of specific year-to-year global mean temperature differences. However, even taking this into account, NASA estimates 2016 was the warmest year with greater than 95 percent certainty.
“2016 is remarkably the third record year in a row in this series,” said GISS Director Gavin Schmidt. “We don’t expect record years every year, but the ongoing long-term warming trend is clear.”
The planet’s average surface temperature has risen about 2.0 degrees Fahrenheit (1.1 degrees Celsius) since the late 19th century, a change driven largely by increased carbon dioxide and other human-made emissions into the atmosphere.
Most of the warming occurred in the past 35 years, with 16 of the 17 warmest years on record occurring since 2001. Not only was 2016 the warmest year on record, but eight of the 12 months that make up the year – from January through September, with the exception of June – were the warmest on record for those respective months. October and November of 2016 were the second warmest of those months on record – in both cases, behind records set in 2015.
Phenomena such as El Niño or La Niña, which warm or cool the upper tropical Pacific Ocean and cause corresponding variations in global wind and weather patterns, contribute to short-term variations in global average temperature. A warming El Niño event was in effect for most of 2015 and the first third of 2016. Researchers estimate the direct impact of the natural El Nino warming in the tropical Pacific increased the annual global temperature anomaly for 2016 by 0.2 degrees Fahrenheit (0.12 degrees Celsius).
Weather dynamics often affect regional temperatures, so not every region on Earth experienced record average temperatures last year. For example, both NASA and NOAA found the 2016 annual mean temperature for the contiguous 48 United States was the second warmest on record. In contrast, the Arctic experienced its warmest year ever, consistent with record low sea ice found in that region for most of the year.
NASA’s analyses incorporate surface temperature measurements from 6,300 weather stations, ship- and buoy-based observations of sea surface temperatures, and temperature measurements from Antarctic research stations. These raw measurements are analyzed using an algorithm that considers the varied spacing of temperature stations around the globe and urban heating effects that could skew the conclusions. The result of these calculations is an estimate of the global average temperature difference from a baseline period of 1951 to 1980.
NOAA scientists used much of the same raw temperature data, but with a different baseline period, and different methods to analyze Earth’s polar regions and global temperatures.
GISS is a laboratory within the Earth Sciences Division of NASA’s Goddard Space Flight Center in Greenbelt, Maryland. The laboratory is affiliated with Columbia University’s Earth Institute and School of Engineering and Applied Science in New York.
NASA monitors Earth's vital signs from land, air and space with a fleet of satellites, as well as airborne and ground-based observation campaigns. The agency develops new ways to observe and study Earth's interconnected natural systems with long-term data records and computer analysis tools to better see how our planet is changing. NASA shares this unique knowledge with the global community and works with institutions in the United States and around the world that contribute to understanding and protecting our home planet.
The full 2016 surface temperature data set and the complete methodology used to make the temperature calculation are available at: http://data.giss.nasa.gov/gistemp
This color-coded map displays a 10 second progression of changing global surface temperatures anomalies from 1880 through 2016. The final frame represents global temperature anomalies averaged from 2012 through 2016 in degrees Celsius. This movie was designed for social media audiences.

Temperature Difference in Degrees Celsius

Global Temperature Anomalies averaged from 2012-2016 in degrees Celsius.

Global Temperature Anomalies averaged from 2002-2006 in degrees Celsius.

Global Temperature Anomalies averaged from 1992-1996 in degrees Celsius.

Global Temperature Anomalies averaged from 1982-1986 in degrees Celsius.

Global Temperature Anomalies averaged from 1972-1976 in degrees Celsius.

Global Temperature Anomalies averaged from 1962-1966 in degrees Celsius.

Global Temperature Anomalies averaged from 1952-1956 in degrees Celsius.

Global Temperature Anomalies averaged from 1942-1946 in degrees Celsius.

Global Temperature Anomalies averaged from 1932-1936 in degrees Celsius.

Global Temperature Anomalies averaged from 1922-1926 in degrees Celsius.

Global Temperature Anomalies averaged from 1912-1916 in degrees Celsius.

Global Temperature Anomalies averaged from 1902-1906 in degrees Celsius.

Global Temperature Anomalies averaged from 1892-1896 in degrees Celsius.
This color-coded map displays a progression of changing global surface temperatures anomalies from 1880 through 2016. The final frame represents global temperature anomalies averaged from 2012 through 2016 in degrees Fahrenheit.

Temperature DIfference colorbar in degrees Fahrenheit

This frame sequence of color-coded global temperature anomalies in robinson projection display a progression of changing global surface temperatures anomalies in Fahrenheit. Each image represents a unique 5 year rolling time period with no fades between datasets. Higher than normal temperatures are shown in red and lower than normal are shown in blue.
This color-coded map displays a 1 minute progression of changing global surface temperatures anomalies from 1880 through 2016 at ultra high definition resolution (3840 x 2160). The final frame represents global temperature anomalies averaged from 2012 through 2016 in degrees Fahrenheit.
Credits
Please give credit for this item to:
NASA/Goddard Space Flight Center Scientific Visualization Studio
Data provided by Robert B. Schmunk (NASA/GSFC GISS)
-
Data visualizer
- Lori Perkins (NASA/GSFC)
-
Scientists
- Gavin A. Schmidt (NASA/GSFC GISS)
- Robert B Schmunk (SIGMA Space Partners, LLC.)
- Reto A. Ruedy (SIGMA Space Partners, LLC.)
-
Writer
- Patrick Lynch (Wyle Information Systems)
-
Producers
- Leslie McCarthy
- Matthew R. Radcliff (USRA)
- Kathryn Mersmann (USRA)
Release date
This page was originally published on Wednesday, January 18, 2017.
This page was last updated on Sunday, December 15, 2024 at 12:07 AM EST.
Series
This page can be found in the following series:Datasets used
-
GISTEMP [GISS Surface Temperature Analysis (GISTEMP)]
ID: 585The GISS Surface Temperature Analysis version 4 (GISTEMP v4) is an estimate of global surface temperature change. Graphs and tables are updated around the middle of every month using current data files from NOAA GHCN v4 (meteorological stations) and ERSST v5 (ocean areas), combined as described in our publications Hansen et al. (2010), Lenssen et al. (2019), and Lenssen et al. (2024).
Credit: Lenssen, N., G.A. Schmidt, M. Hendrickson, P. Jacobs, M. Menne, and R. Ruedy, 2024: A GISTEMPv4 observational uncertainty ensemble. J. Geophys. Res. Atmos., 129, no. 17, e2023JD040179, doi:10.1029/2023JD040179.
This dataset can be found at: https://data.giss.nasa.gov/gistemp/
See all pages that use this dataset
Note: While we identify the data sets used on this page, we do not store any further details, nor the data sets themselves on our site.


![Eight of the 12 months – from January through September, with the exception of June – were the hottest of those respective months on record. October, November and December of 2016 were the second hottest of those months on record – in all three cases, behind records set in 2015.Music credit: In Dreams We Trust by Chris White [PRS] and Guy Hatfield [PRS]Complete transcript available.](/vis/a010000/a012400/a012475/LARGE_MP4-124752016globaltemp_large.02469_print.jpg)