GeoXO - OCX
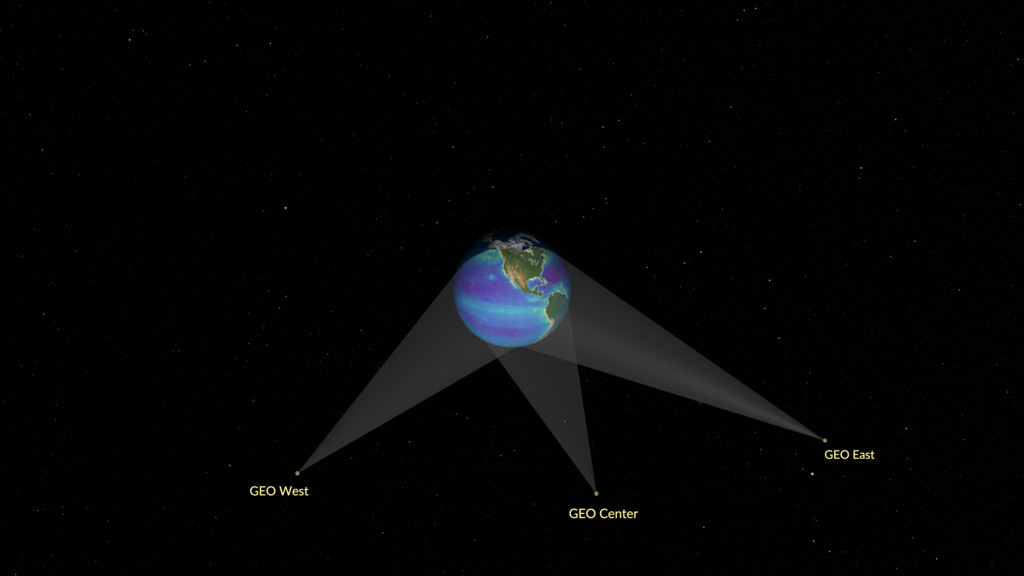
This visualization begins with a global view of Earth, showcasing a hypothetical scanning pattern for the OCX instrument on the proposed GeoXO East satellite. The camera then zooms in on several scan regions, displaying false-color ocean data. A spectral "hypercube" of data is revealed next, with each color-tinted layer representing a specific band of collected data for a given location. Finally, the camera transitions into a swath of satellite imagery, highlighting the proposed OCX resolution.
One of the most significant new features of GeoXO will be the groundbreaking Ocean Color Instrument (OCX), which is specifically engineered to observe aquatic conditions related to assessing ocean productivity, ecosystem change, coastal and inland water quality, seafood safety, and hazards like harmful algal blooms. Unique to OCX is its superior spatial resolution, exceeding 300 meters of Ground Sampling Distance, and its high temporal resolution, enabling observations at least every two hours during daylight. OCX is also a specialized “hyperspectral” instrument, which means that it can better distinguish hazards such as marine pollution or harmful algal blooms to help improve forecast systems. This instrument configuration solves a series of ubiquitous problems faced in remote sensing, enabling us to see around pervasive cloud cover, adequately resolve dynamic coastal features, and provide better information about the composition of the water. A constant gaze over the 3.4 million square nautical miles of the U.S. EEZ will provide consistent, hyperspectral data at a high cadence that, working around clouds, finally gets us the right data for ecosystem science to support coastal management.

Still image - GeoXO East satellite and a hypothetical scanning pattern for the OCX instrument.

Still image - OCX scan regions with false color ocean data.

Still image - A spectral "hypercube" of data, with each color-tinted layer representing a specific band of collected data for a given location.
Credits
Please give credit for this item to:
NASA's Scientific Visualization Studio
-
Visualizers
- Kel Elkins (USRA)
- Cindy Starr (Global Science and Technology, Inc.)
-
Producer
- Elizabeth C. Wilk (eMITS)
-
Scientist
- Ryan Vandermeulen (NOAA)
Release date
This page was originally published on Monday, December 9, 2024.
This page was last updated on Tuesday, February 18, 2025 at 12:14 AM EST.
Datasets used
-
GOES-East [GOES-13/N: Imager]
ID: 906 -
Ocean Color Instrument [PACE: OCI]
ID: 1208This dataset can be found at: https://pace.oceansciences.org/oci.htm
See all pages that use this dataset
Note: While we identify the data sets used on this page, we do not store any further details, nor the data sets themselves on our site.


![Music:“A Sight To Behold” by Will Slater [PRS] & Benji Paul Merrison [PRS]; BBC Production Music; Universal Production Music“Extrapolations” by Andrii Yefymov [BMI]; Hypersonic Music; Universal Production MusicUsing data from current satellites, A Day in the Life of GeoXO imagines what this new generation of geostationary Earth observing satellites will see, and how their instruments will work together to provide near real-time information to forecasters, decision-makers, and first responders. GeoXO will contribute to the protection of life and property within the United the States. All in a day's work.This video can be freely shared and downloaded. While the video in its entirety can be shared without permission, some individual imagery provided by Artbeats, BlackBoxGuild/Pond5, sinenkiy/Pond5, and Pond5 are obtained through permission and may not be excised or remixed in other products. For more information on NASA’s media guidelines, visit https://www.nasa.gov/multimedia/guidelines/index.html](/vis/a010000/a014700/a014740/YouTubeThumbnail_GeoXO.jpg)