Northern California Fires in September 2020
This visualization shows the lightning over California on August 16 and 17, 2020 that caused 38 separate fires to ignite. These eventually combined into the August Complex fire, the first recorded gigafire in California history, which burned until November 12 consuming 1,614 square miles (4,180 square kilometers). As the lightning fades, a series of images shows the smoke emanating from the fires on September 8 of that year. The visible smoke is followed by a series showing the Aerosol Optical Depth (a unitless quantitative metric of how much smoke is present in the atmosphere) as the smoke particles were transported across the Western US and Canada over a 10 day period.
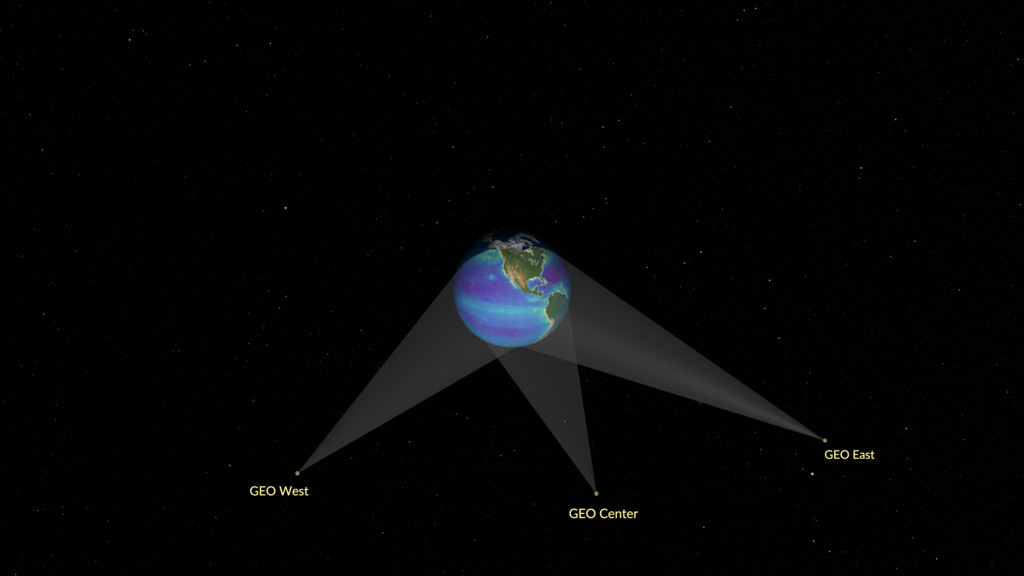
The GeoXO satellite system will watch over the Western Hemisphere and will provide real-time, high-resolution visible and infrared imagery for monitoring Earth’s weather, ocean, and environment. This observing system will also deliver information that sophisticated climate-forecasting models use to predict weather patterns, including emerging patterns caused by climate change.
This visualization highlights how three instruments onboard a GeoXO satellite work in concert to provide data of environmental hazards more quickly than ever before, enabling faster response on the ground to these hazards.
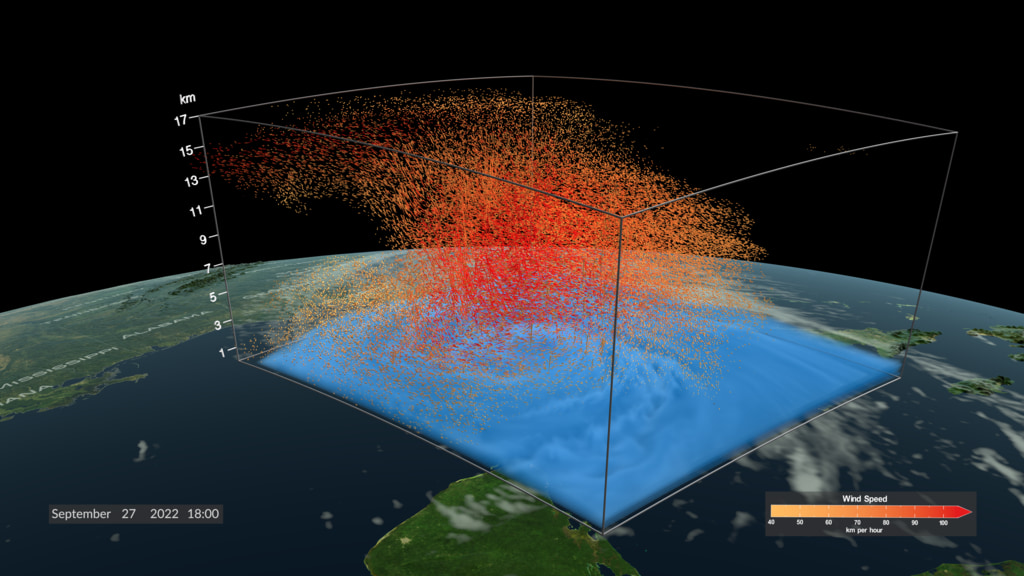
- GeoXO Lightning Mapper (LMX), improving on GOES-R’s visible/infrared imagery and lightning mapping capabilities, will detect, locate, and measure the intensity, duration, and extent of lightning flashes. LMX will improve current hazard detection, hurricane intensity prediction, wildfire detection and response, precipitation estimation, and aviation hazard mitigation capabilities.
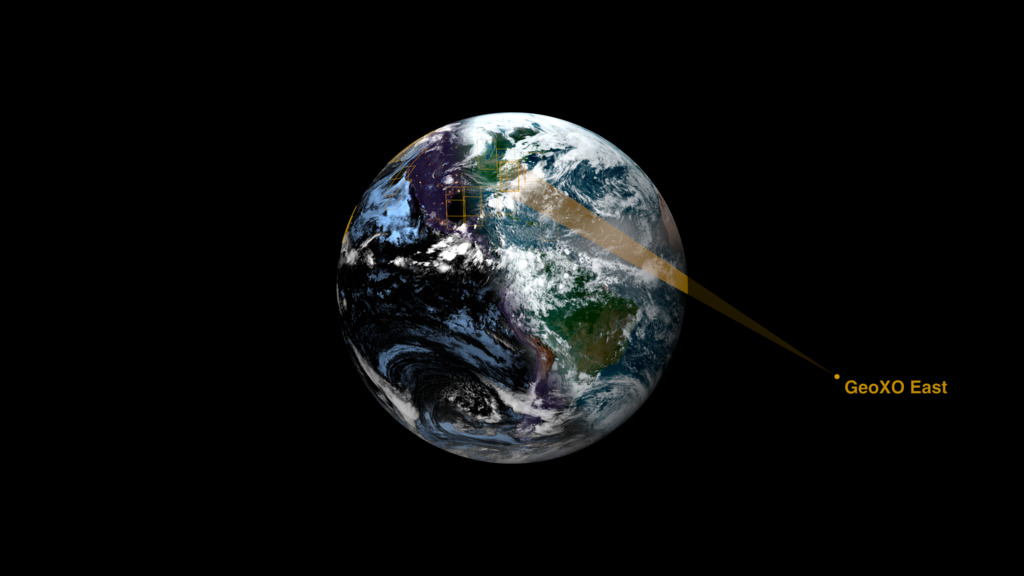
- The GeoXO Imager (GXI) will observe the Western Hemisphere and provide variable area imagery and information about Earth’s surface, such as vegetation, water, clouds, moisture, and smoke.
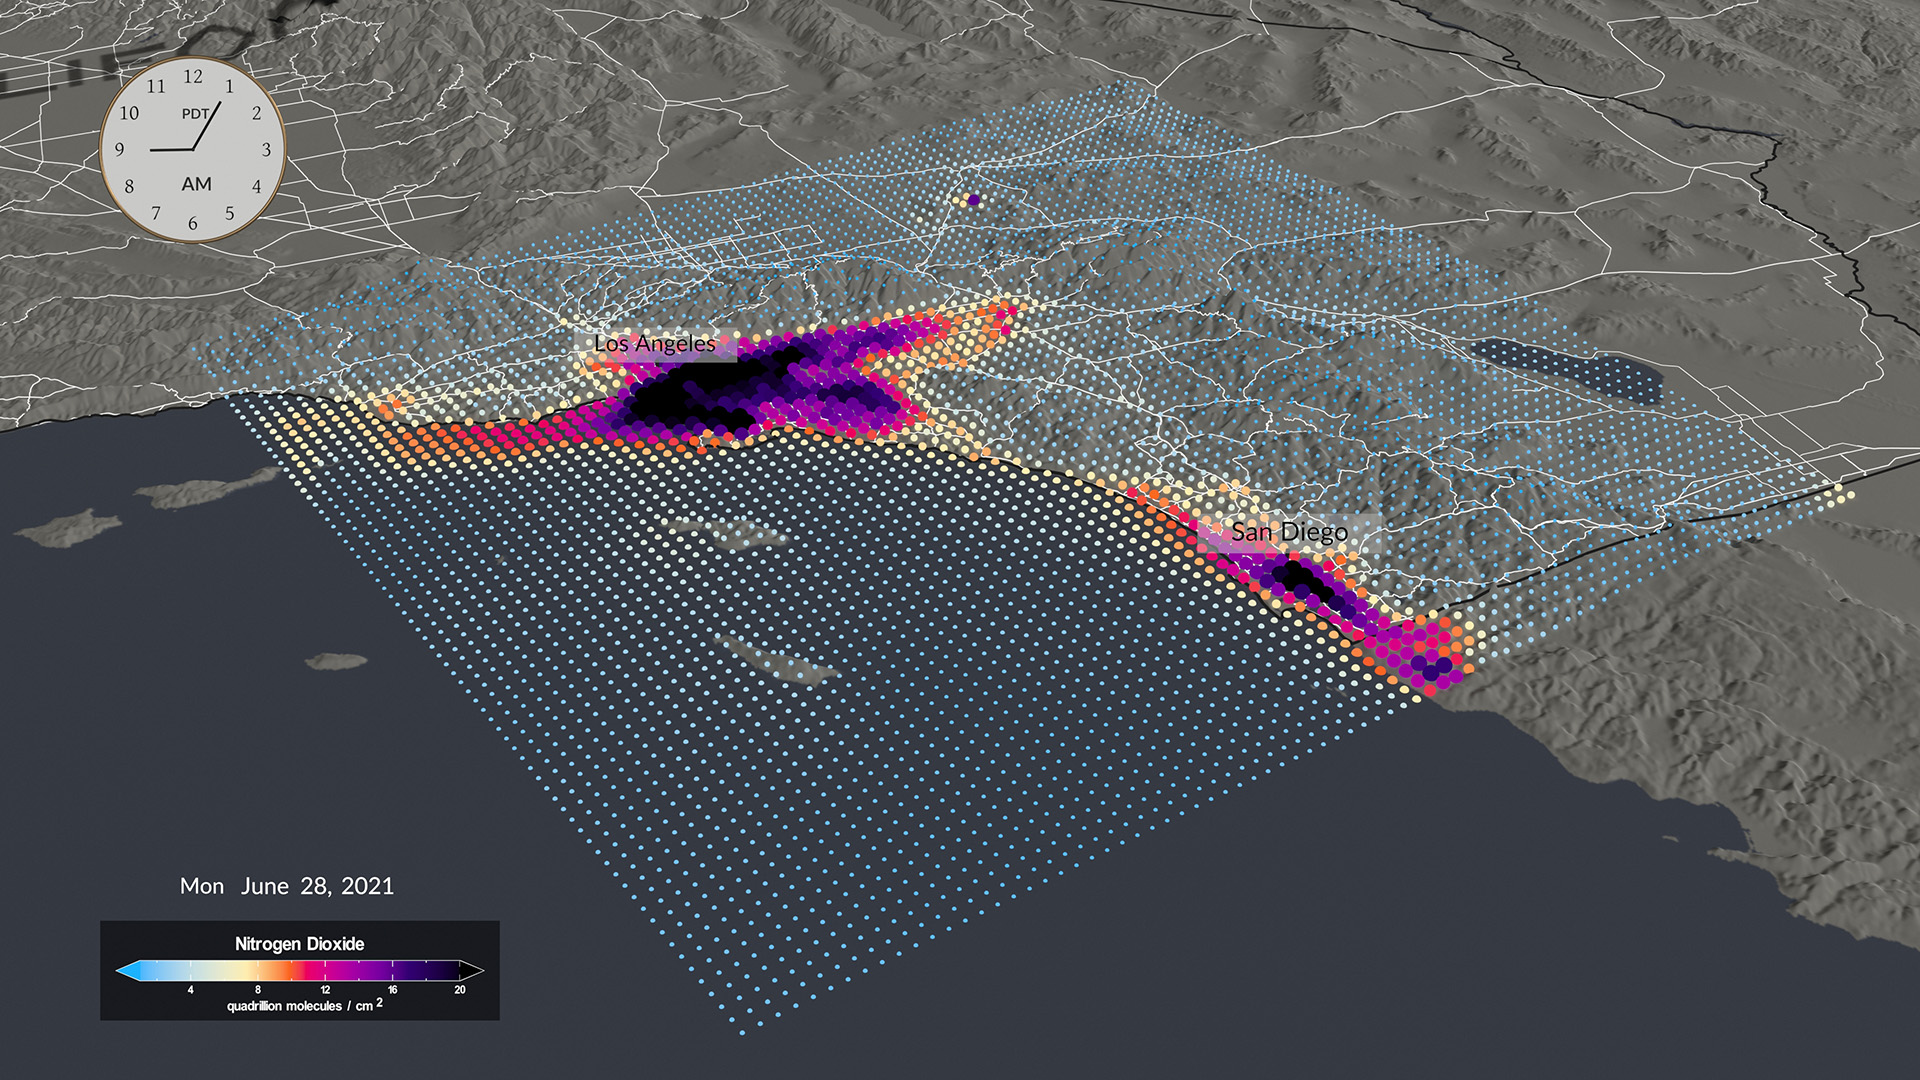
- The GeoXO Atmospheric Composition instrument (ACX) will provide hourly observations of air pollutants emitted by transportation, power generation, industry, oil and gas extraction, volcanoes, and wildfires, as well as secondary pollutants generated from these emissions once they are in the atmosphere. By providing continuous observations and measurements of atmospheric composition, ACX data will improve air quality monitoring and forecasting as well as enable mitigation of health impacts from severe pollution and smoke events.
The visualization of lightning, smoke and Aerosol Optical Depth without the date, clock and colorbar overlay.

This image shows lightning detected over California on August 20, 2020.

This image shows fires detected in California and Oregon on September 8, 2020 along with the smoke eminating from the fires.

This image shows aerosol optical depth at 550 nm over California and Oregon on September 9, 2020.

The overlay containing date, clock and colorbar with transparency.
Credits
Please give credit for this item to:
NASA's Scientific Visualization Studio
-
Visualizers
- Cindy Starr (Global Science and Technology, Inc.)
- Horace Mitchell (NASA/GSFC)
- Greg Shirah (NASA/GSFC)
- Kel Elkins (USRA)
-
Scientists
- Dan Lindsey (NOAA)
- Shobha Kondragunta (NOAA)
- Scott Rudlosky (NOAA/NESDIS/STAR)
- Zigang Wei (NOAA)
-
Communications lead
- Michelle Smith (NOAA)
-
Producer
- Elizabeth C. Wilk (eMITS)
Release date
This page was originally published on Monday, December 9, 2024.
This page was last updated on Tuesday, February 18, 2025 at 12:14 AM EST.
Datasets used
-
GLM L2 Lightning Detection Gridded Product (OR_GLM-L2-GLMF-M3_G17) [GOES 17: GOES R Series Geostationary Lightning Mapper]
ID: 1223The Lightning Detection Gridded product generates fields starting from the GLM Lightning Detection Events, Groups, Flashes product. It consists of flash extent density, event density, average flash area, average group area, total energy, flash centroid density, and group centroid density.
Credit: Rudlosky, Scott .2022. GOES-R Geostationary Lightning Mapper (GLM) Gridded Data Products OR_GLM-L2-GLMF-M3_G17. Dataset available online from the NASA Global Hydrometeorology Resource Center DAAC, Huntsville, Alabama, U.S.A. DOI: http://dx.doi.org/10.5067/GLM/GRID/DATA101
This dataset can be found at: https://cmr.earthdata.nasa.gov/search/concepts/C2278812167-GHRC_DAAC.html
See all pages that use this dataset -
GeoColor (GeoColor) [GOES-17: Advanced Baseline Imager (ABI)]
ID: 1225GeoColor is a multi-spectral algorithm using five channels from the Advanced Baseline Imager (ABI) along with some static ancillary data to approximate true color during the daytime and highlight high and low clouds at night.
Credit: Steven D. Miller, Steven D. Miller, Curtis J. Seaman, Jeremy E. Solbrig
This dataset can be found at: https://journals.ametsoc.org/view/journals/atot/37/3/JTECH-D-19-0134.1.xml
See all pages that use this dataset -
Simulated Aerosol Optical Depth from the CMAQ model (Simulated Aerosol Optical Depth from the CMAQ model)
ID: 1235Credit: Jianping Huang
This dataset can be found at: https://www.epa.gov/cmaq
See all pages that use this dataset
Note: While we identify the data sets used on this page, we do not store any further details, nor the data sets themselves on our site.


![Music:“A Sight To Behold” by Will Slater [PRS] & Benji Paul Merrison [PRS]; BBC Production Music; Universal Production Music“Extrapolations” by Andrii Yefymov [BMI]; Hypersonic Music; Universal Production MusicUsing data from current satellites, A Day in the Life of GeoXO imagines what this new generation of geostationary Earth observing satellites will see, and how their instruments will work together to provide near real-time information to forecasters, decision-makers, and first responders. GeoXO will contribute to the protection of life and property within the United the States. All in a day's work.This video can be freely shared and downloaded. While the video in its entirety can be shared without permission, some individual imagery provided by Artbeats, BlackBoxGuild/Pond5, sinenkiy/Pond5, and Pond5 are obtained through permission and may not be excised or remixed in other products. For more information on NASA’s media guidelines, visit https://www.nasa.gov/multimedia/guidelines/index.html](/vis/a010000/a014700/a014740/YouTubeThumbnail_GeoXO.jpg)