Nitrogen Dioxide over the Continental US and Los Angeles
This visualization uses proxy and model data of NO2 tropospheric vertical columns over the continental US and southern California to show how the GeoXO ACX instrument will monitor the region. This version has a clock, text and color bar overlay.
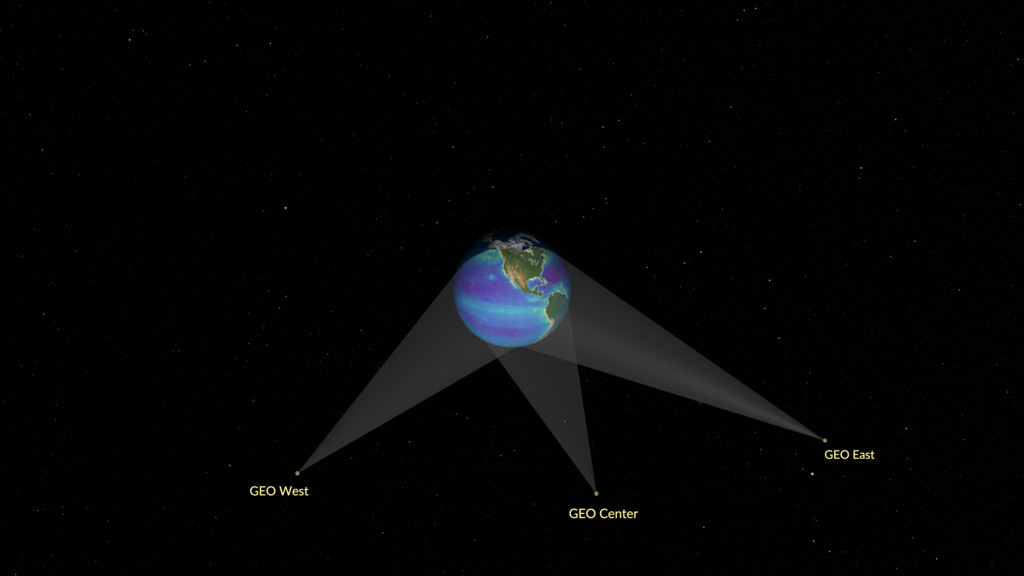
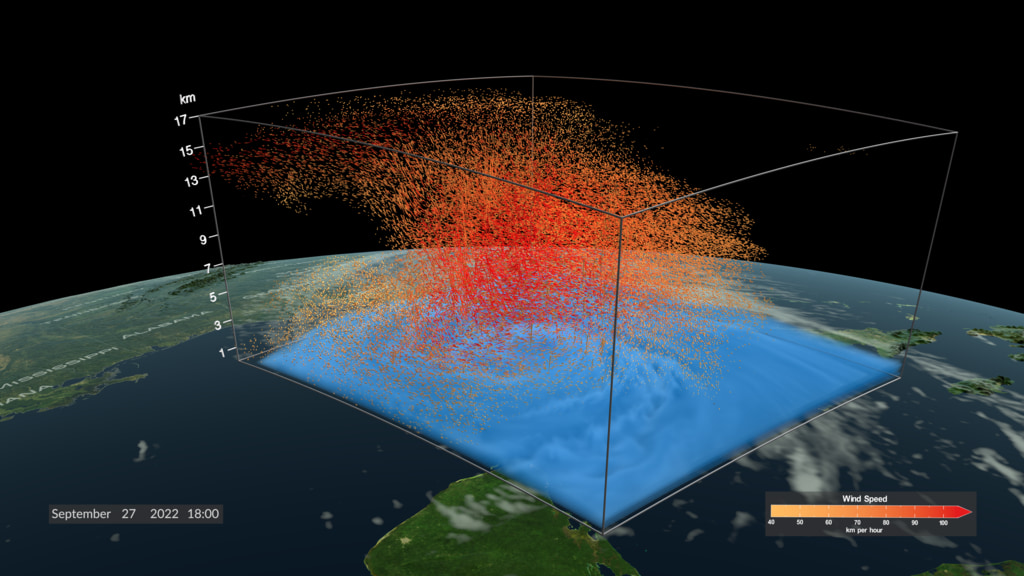
NOAA’s Geostationary Extended Observations (GeoXO) satellite system will expand observations of Earth that the GOES-R Series currently provides from geostationary orbit. GeoXO will watch over the Western Hemisphere as part of NOAA’s observing system that supports short-term forecasts and warnings of extreme weather and environmental hazards.
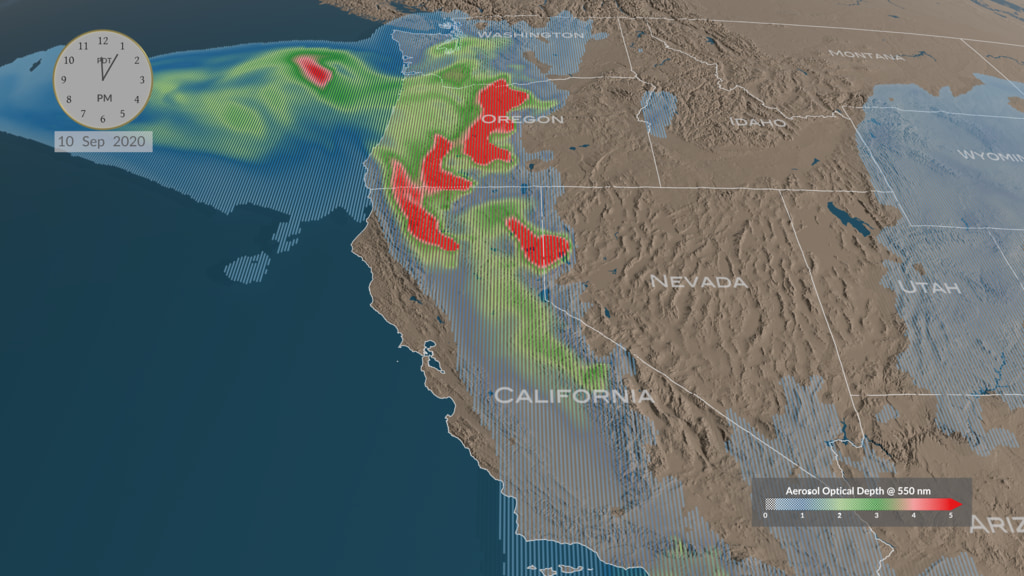
The Atmospheric Composition instrument (ACX) will be a hyperspectral spectrometer that measures a wide spectrum of light from ultraviolet (UV) to visible. ACX will provide hourly observations of air pollutants emitted by transportation, power generation, industry, oil and gas extraction, volcanoes, and wildfires, as well as secondary pollutants generated from these emissions once they are in the atmosphere. By providing continuous observations and measurements of atmospheric composition, ACX data will improve air quality monitoring and forecasting as well as enable mitigation of health impacts from severe pollution and smoke events. ACX will contribute to improved operational air quality, hazard, and wildfire observation and prediction efforts.
Using proxy data for the tropospheric vertical columns of nitrogen dioxide, NO2, from the TEMPO mission and a numerical air quality model, this visualization shows how the geosynchronous GEO Center satellite will continually monitor pollution hourly over the US during the daylight hours. Upon zooming into Southern California, finer details of pollution gradients are clearly visible over the Los Angeles/San Diego region. Here the concentration of NO2 is shown in shades of light blue to dark pink/purple indicating values ranging from low to high
This visualization uses proxy and model data of NO2 tropospheric vertical columns over the continental US and southern California to show how the GeoXO ACX instrument will monitor the region. This version does not have the clock, text or color bar overlay.


Compare the difference in the tropospheric vertical columns of NO2 over Los Angeles and San Diego between Sunday, June 27, 2021 at 9:00 AM and the same time on Monday, June 28, 2021.
This is the overlay for the above NO2 visualization over the continental US and southern California with transparency.
Credits
Please give credit for this item to:
NASA's Scientific Visualization Studio
-
Visualizers
- Cindy Starr (Global Science and Technology, Inc.)
- Greg Shirah (NASA/GSFC)
- Kel Elkins (USRA)
- Trent L. Schindler (USRA)
- Alex Kekesi (Global Science and Technology, Inc.)
- Andrew J Christensen (SSAI)
-
Scientists
- Andrew K. Heidinger (NOAA)
- Dan Lindsey (NOAA)
- Shobha Kondragunta (NOAA)
- Joanna Joiner (NASA/GSFC)
- Gregory Frost (NOAA)
- Brian McDonald (NOAA)
- Colin Harkins (Cooperative Institute for Research in Environmental Sciences)
- Aaron Naeger (NASA/MSFC)
-
Communications lead
- Michelle Smith (NOAA)
-
Producer
- Elizabeth C. Wilk (eMITS)
-
Technical support
- Ian Jones (ADNET Systems, Inc.)
- Laurence Schuler (ADNET Systems, Inc.)
Release date
This page was originally published on Monday, December 9, 2024.
This page was last updated on Tuesday, February 18, 2025 at 12:13 AM EST.
Datasets used
-
BMNG (Blue Marble: Next Generation) [Terra and Aqua: MODIS]
ID: 508Credit: The Blue Marble data is courtesy of Reto Stockli (NASA/GSFC).
This dataset can be found at: http://earthobservatory.nasa.gov/Newsroom/BlueMarble/
See all pages that use this dataset -
CPC (Climate Prediction Center) Cloud Composite
ID: 600Global cloud cover from multiple satellites
See all pages that use this dataset -
Simulated TEMPO Proxy Level 2 nitrogen dioxide product over the Continental US
ID: 1194 -
High resolution NOAA WRF-Chem model simulations over Los Angeles
ID: 1195
Note: While we identify the data sets used on this page, we do not store any further details, nor the data sets themselves on our site.


![Music:“A Sight To Behold” by Will Slater [PRS] & Benji Paul Merrison [PRS]; BBC Production Music; Universal Production Music“Extrapolations” by Andrii Yefymov [BMI]; Hypersonic Music; Universal Production MusicUsing data from current satellites, A Day in the Life of GeoXO imagines what this new generation of geostationary Earth observing satellites will see, and how their instruments will work together to provide near real-time information to forecasters, decision-makers, and first responders. GeoXO will contribute to the protection of life and property within the United the States. All in a day's work.This video can be freely shared and downloaded. While the video in its entirety can be shared without permission, some individual imagery provided by Artbeats, BlackBoxGuild/Pond5, sinenkiy/Pond5, and Pond5 are obtained through permission and may not be excised or remixed in other products. For more information on NASA’s media guidelines, visit https://www.nasa.gov/multimedia/guidelines/index.html](/vis/a010000/a014700/a014740/YouTubeThumbnail_GeoXO.jpg)