Hurricane Ian's Clouds, Lightning, Humidity and Winds
This visualization begins with an image sequence of cloud and lightning images of Hurricane Ian created by Cooperative Institute for Research in the Atmosphere (CIRA) and NOAA. The image sequence fades to show the volume of humidity (shown in blue) along with the wind flows near the surface. As the camera pulls back we see the humidity in a 9 degree by 9 degree region off the western coast of Florida. A box containing this region gradually grows in altitude showing the fast wind circulation above the humidity volume up to an altitude of 17 km.
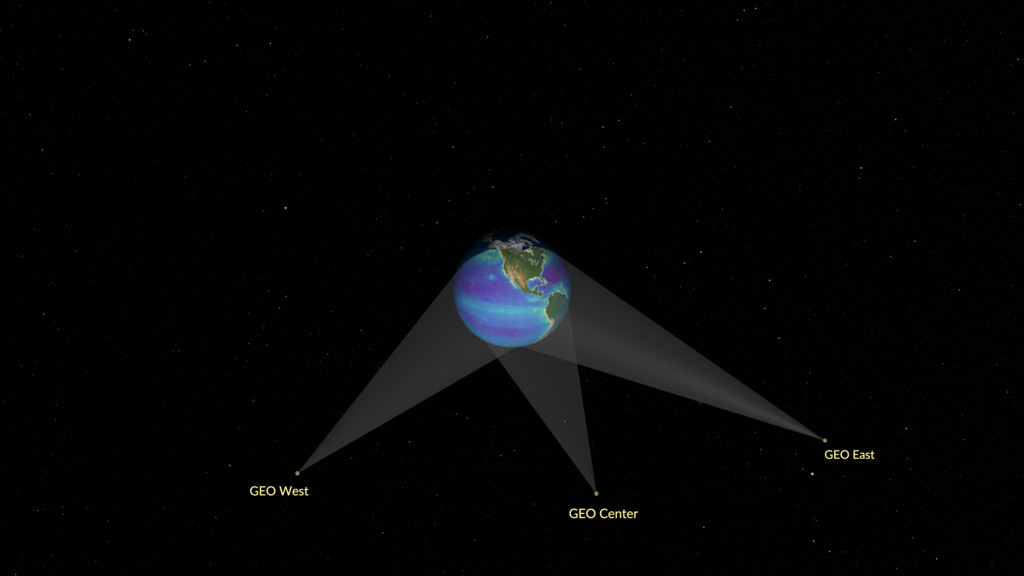
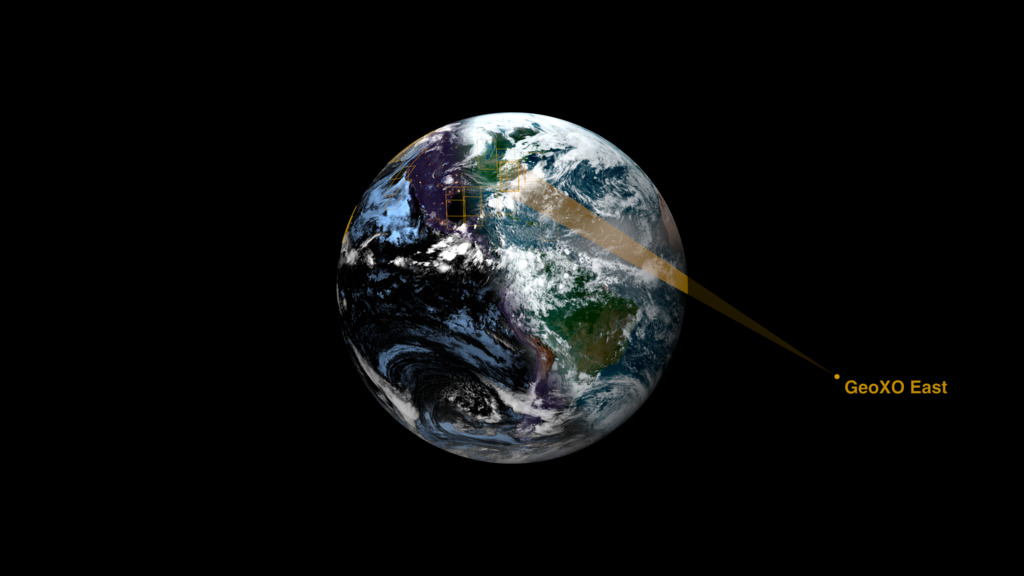
NOAA’s Geostationary Extended Observations (GeoXO) satellite system will expand observations of Earth that the GOES-R Series currently provides from geostationary orbit. GeoXO will watch over the Western Hemisphere as part of NOAA’s observing system that supports short-term forecasts and warnings of extreme weather and environmental hazards. The GeoXO Sounder (GXS) will provide real-time information about the vertical distribution of atmospheric moisture, winds, and temperature in clear sky scenes. GXS will increase full atmosphere sensing over the United States by ten times compared to existing low-Earth-orbiting satellites, improving storm tracking and storm strength monitoring. GXS data will feed advanced numerical weather prediction models and improve short-term severe weather forecasting. GXS will measure vertical changes in temperature and moisture – seeing a profile of the atmosphere is the key to forecasting convection. Data from the instrument will help forecasters give longer lead-time to warn residents to seek shelter from hail- and tornado-producing storms. With temperature and humidity information, weather forecasters will have new insights into convection and precipitation. GXS data will enable monitoring of these factors over time.
This visualization begins by showing a sequence of cloud and lightning images centered on the eye of Hurricane Ian provided courtesy of CIRA and NOAA. The image sequence fades to show the volume of humidity shown in blue along with the wind flows near the surface. The wind flows are colored by speed with gold indicating slower and red indicating faster winds. As the camera pulls back we see the humidity in a 9 degree by 9 degree region off the western coast of Florida with a box revealing the winds circulating over the humidity. This region is gradually extended in altitude to show the fast wind circulation up to an altitude or 17 km above Hurricane Ian.

This is an image of the cloud formation and lightning from Hurricane Ian. This image along with the open sequence of images shown in this visualization are provided courtesy of CIRA and NOAA.

This is an image of the wind flows around the eye of Hurricane Ian on September 27, 2022 at 2:00 PM EDT (or 18:00 GMT). The blue volumetric background is the specific humidity.

This image show the specific humidity and the fast winds above Hurricane Ian as it approaches Florida on September 27th, 2022 at 2:00 PM EDT (or 18:00 GMT).
This visualization is identical to the one above but without the date and colorbar overlay.

The date and colorbar image with transparency
Credits
Please give credit for this item to:
NASA's Scientific Visualization Studio
-
Visualizers
- Cindy Starr (Global Science and Technology, Inc.)
- Horace Mitchell (NASA/GSFC)
- Greg Shirah (NASA/GSFC)
- Kel Elkins (USRA)
- Andrew J Christensen (SSAI)
- Mark SubbaRao (NASA/GSFC)
-
Scientists
- Andrew K. Heidinger (NOAA)
- Dan Lindsey (NOAA)
-
Communications lead
- Michelle Smith (NOAA)
-
Producer
- Elizabeth C. Wilk (eMITS)
-
Technical support
- Ian Jones (ADNET Systems, Inc.)
- Laurence Schuler (ADNET Systems, Inc.)
Release date
This page was originally published on Monday, December 9, 2024.
This page was last updated on Friday, March 28, 2025 at 12:16 AM EDT.
Datasets used
-
MERRA-2 (MERRA-2)
ID: 1134 -
HWRF model (Hurricane Weather Research and Forecast model)
ID: 1191This dataset can be found at: https://www.weather.gov/sti/coastalact_hwrfreanalysis
See all pages that use this dataset -
Advanced Baseline Imager (ABI) channel 2 overlaid with GOES-16 Geostationary Lightning Mapper (GLM) Group Energy Density (Advanced Baseline Imager (ABI) channel 2 overlaid with GOES-16 Geostationary Lightning Mapper (GLM) Group Energy Density) [GOES-16: Advanced Baseline Imager (ABI)]
ID: 1224GOES-16 Advanced Baseline Imager (ABI) channel 2 (0.64 micrometers) data every 1 minute from 27 Sep. 2022 at 14:25 UTC through 19:22 UTC, overlaid with GOES-16 Geostationary Lightning Mapper (GLM) Group Energy Density every 1 minute.
Credit: Cooperative Institute for Research in the Atmosphere (CIRA) and NOAA
See all pages that use this dataset
Note: While we identify the data sets used on this page, we do not store any further details, nor the data sets themselves on our site.
![Music:“A Sight To Behold” by Will Slater [PRS] & Benji Paul Merrison [PRS]; BBC Production Music; Universal Production Music“Extrapolations” by Andrii Yefymov [BMI]; Hypersonic Music; Universal Production MusicUsing data from current satellites, A Day in the Life of GeoXO imagines what this new generation of geostationary Earth observing satellites will see, and how their instruments will work together to provide near real-time information to forecasters, decision-makers, and first responders. GeoXO will contribute to the protection of life and property within the United the States. All in a day's work.This video can be freely shared and downloaded. While the video in its entirety can be shared without permission, some individual imagery provided by Artbeats, BlackBoxGuild/Pond5, sinenkiy/Pond5, and Pond5 are obtained through permission and may not be excised or remixed in other products. For more information on NASA’s media guidelines, visit https://www.nasa.gov/multimedia/guidelines/index.html](/vis/a010000/a014700/a014740/YouTubeThumbnail_GeoXO.jpg)